
Insights
Spring freight is starting to move. From produce season to rising diesel prices, here’s what owner operators should watch in 2026.
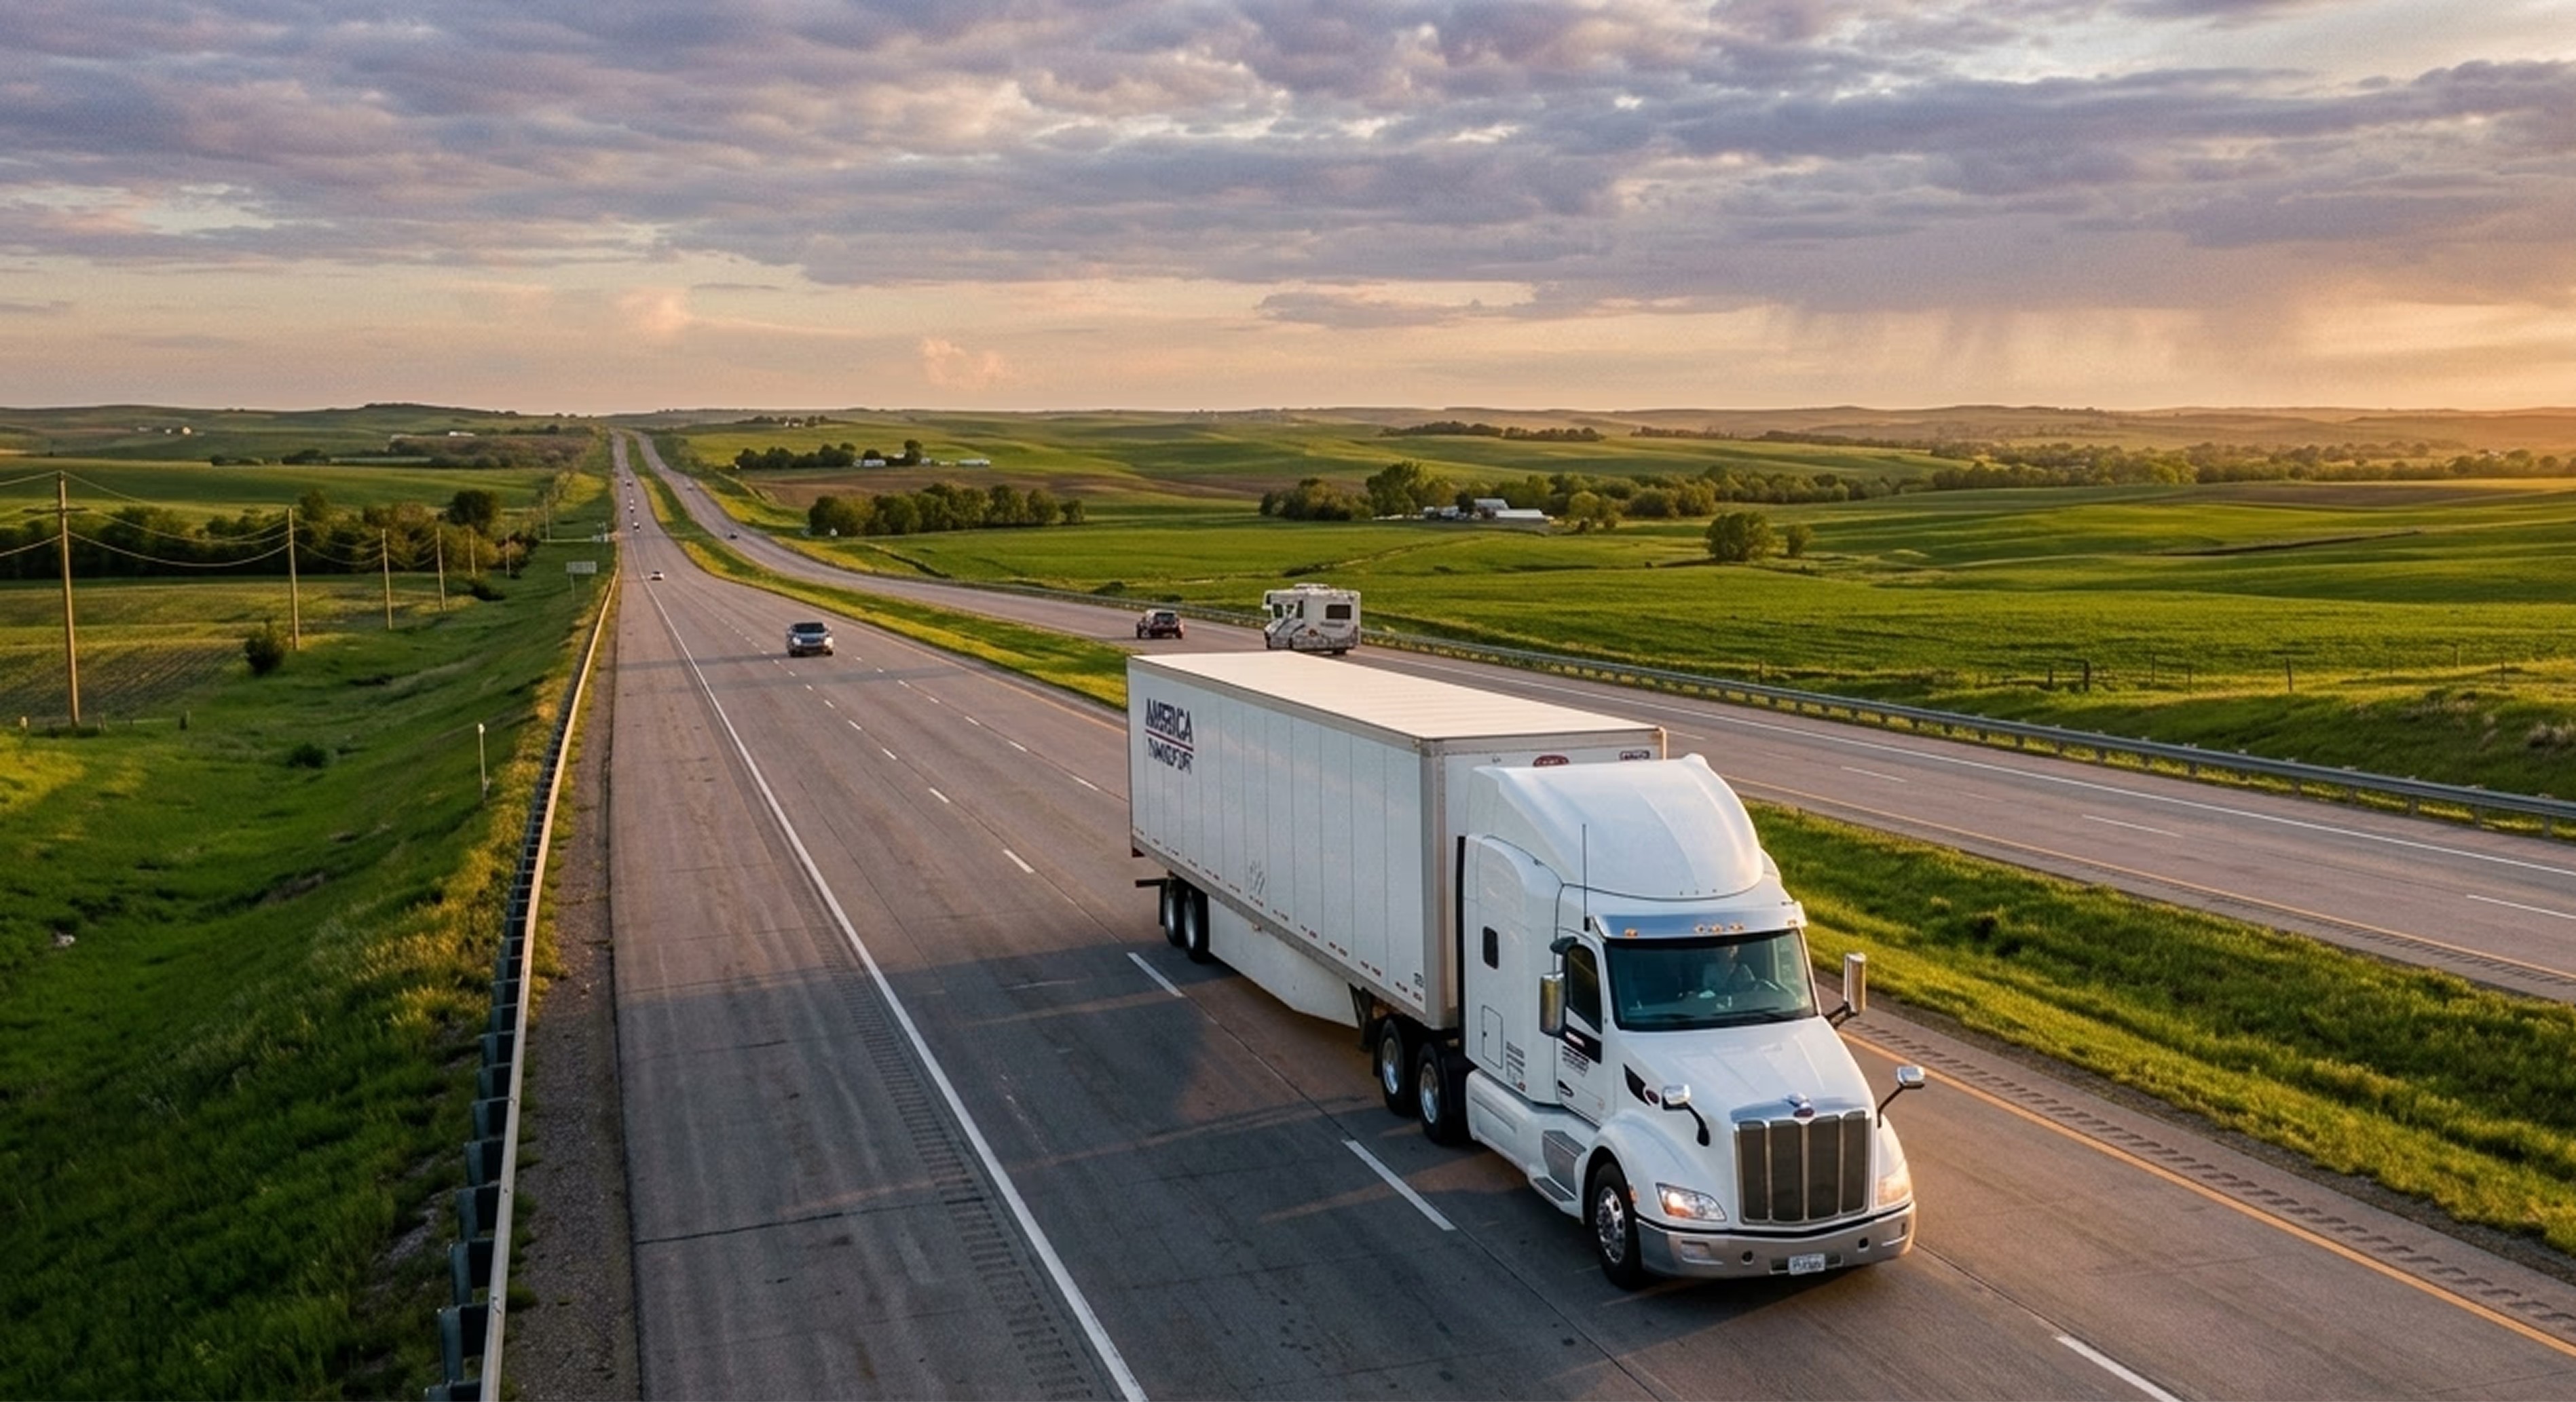
Spring is one of the busiest freight seasons in trucking, and 2026 is shaping up differently than the past two years. Spot rates are beginning to stabilize after a long downturn, capacity has gradually left the market, and diesel prices are climbing again. Load board activity is reflecting these shifts too, with posted loads and available trucks starting to move in a more favorable direction for carriers. Together, these signals suggest the freight market may be slowly rebalancing.
For owner operators, the key question isn’t just whether the market is improving, but where freight demand is moving and how seasonal trends could affect rates, lanes, and operating costs.
Where the Freight Market Stands Right Now
After nearly two years of freight recession, early indicators suggest the trucking market may be stabilizing.
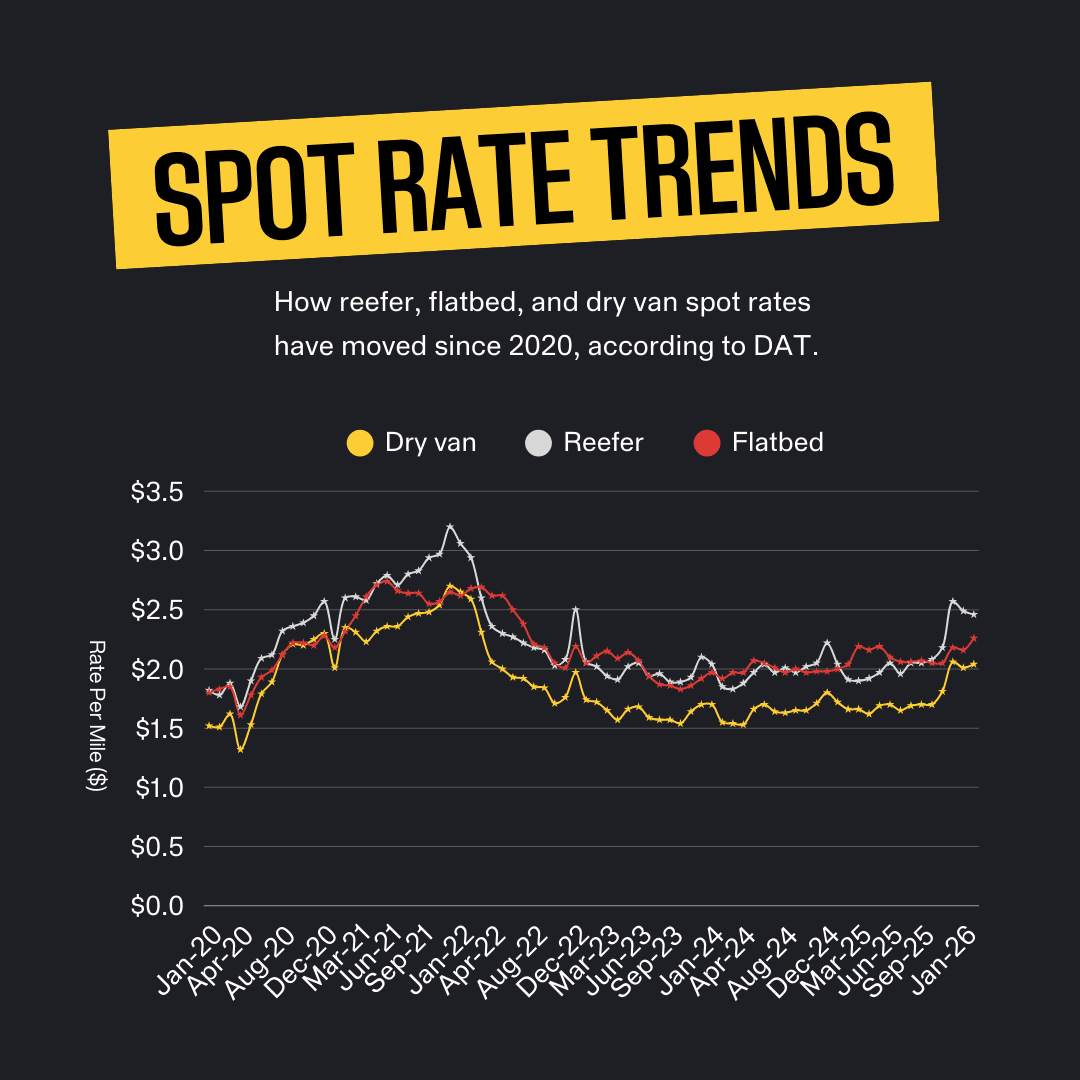
Spot rate data from DAT Freight & Analytics shows rates beginning to trend up across several trailer types. The increases are modest, but the shift in direction is notable after a long period of declining rates.
Current market signals suggest:
Reefer rates are leading the rebound
Flatbed rates have remained relatively steady
Dry van demand is improving but still competitive
Industry capacity has slowly tightened
Many trucking companies shut down during the freight slowdown, especially smaller businesses and independent owner operators who couldn't keep operating with low pay rates and high costs. As the number of available trucks decreases, the freight market will likely start to stabilize.
One signal pointing toward potential freight improvement is coming from outside trucking: manufacturing demand.
Manufacturing Data Signaling More Dry Van Freight
Manufacturing activity is usually one of the earliest indicators of truckload demand.
When factories get more orders, those goods need to move through supply chains, typically by truck. Recent data from the Institute for Supply Management (ISM) shows both new manufacturing orders and order backlogs increasing, a sign that production activity may be strengthening.
Historically, trucking demand tends to follow manufacturing activity with a short delay. As goods move from factories to warehouses and distribution centers, dry van freight activity increases.
For owner operator hauling dry van freight, this could mean stronger demand in lanes tied to:
Midwest manufacturing hubs
Retail distribution centers
Regional industrial corridors
Dry van is still the most competitive segment of the truckload market, so improvements are expected to be slow and steady. While manufacturing signals may support future dry van demand, seasonal freight tends to appear more quickly in refrigerated trucking.
Produce Season Could Strengthen Reefer Freight
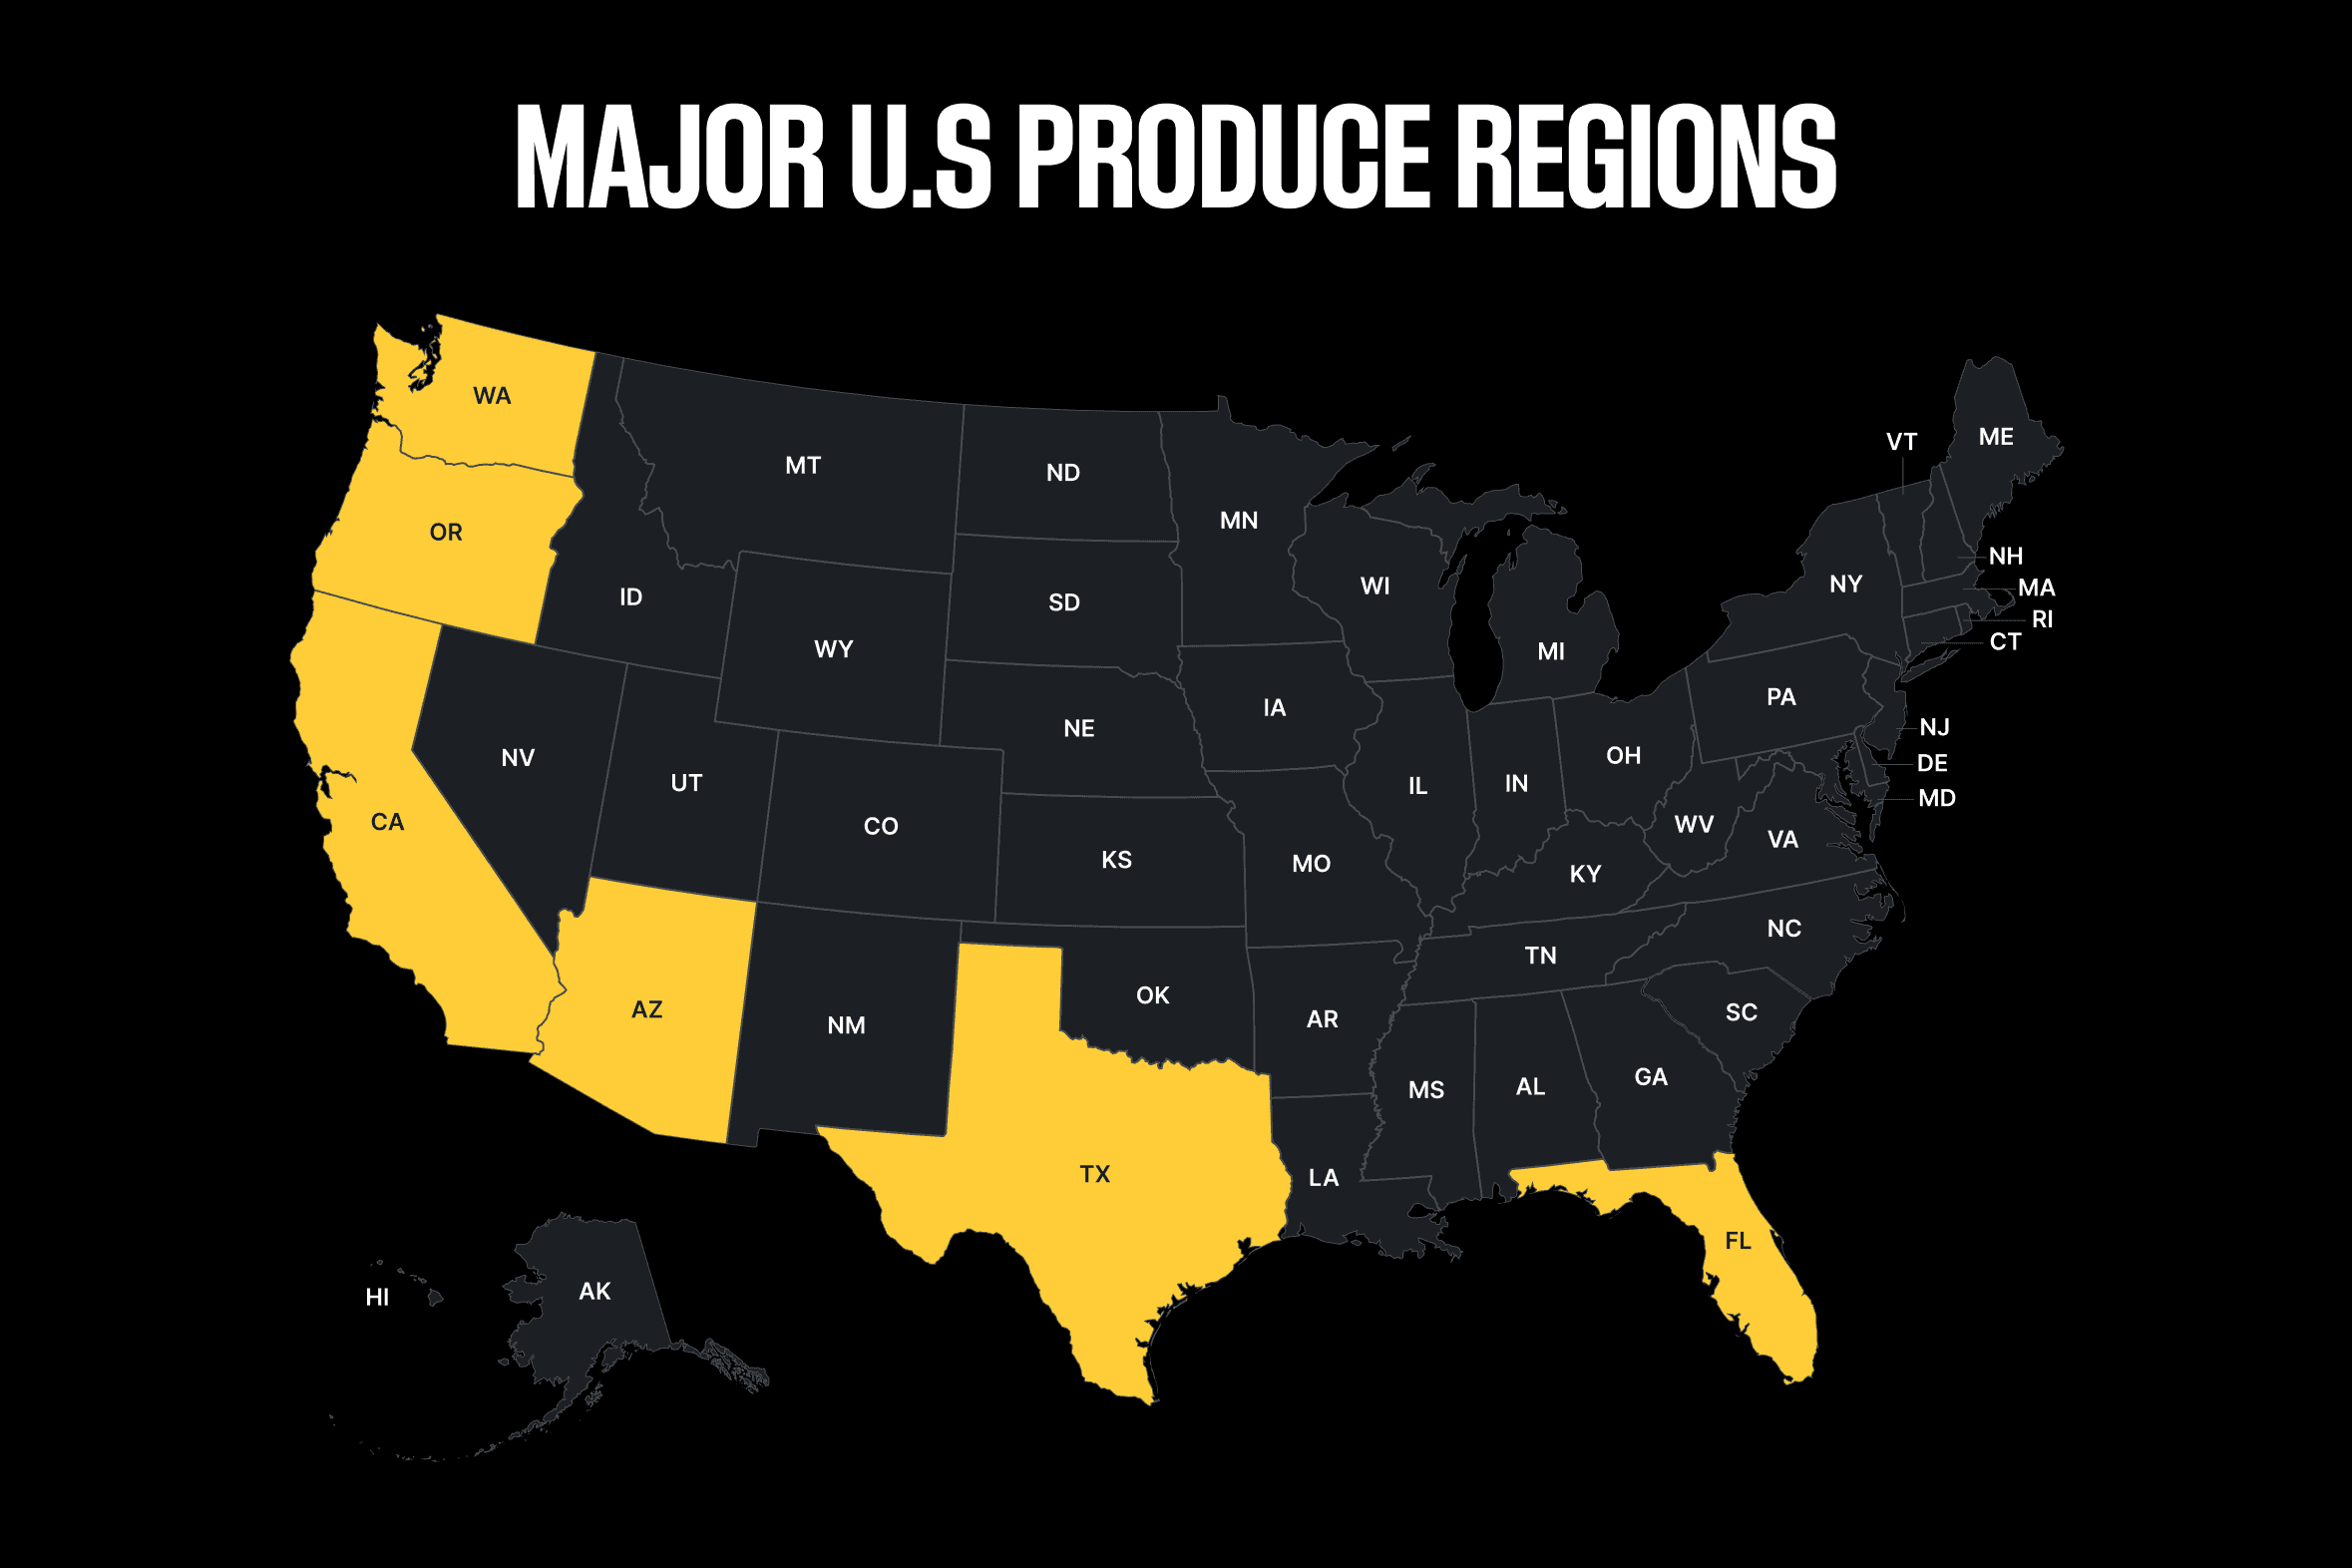
Spring produce season is one of the most predictable sources of seasonal freight demand in trucking. As agricultural harvests begin, large volumes of produce must move quickly from farms to grocery distribution centers across the country. This typically creates strong demand for refrigerated trailers.
Major U.S. produce regions include:
California
Florida
Texas
Arizona
Pacific Northwest
Produce season typically begins in March in Florida and Texas, expands through California and Arizona in late spring, and continues across multiple regions through the summer.
Seasoned drivers often watch these harvest cycles closely. When crops begin moving, refrigerated freight demand can increase quickly, sometimes tightening truck availability in key regions.
Example Spring Produce Freight Lanes
As produce harvests ramp up, certain freight lanes often see more consistent refrigerated traffic as shipments move from growing regions to major population centers.
Examples of common early-season produce lanes include:
Florida ➡️ Northeast distribution markets
California ➡️ Midwest grocery and retail hubs
Texas ➡️ Southeast regional produce distribution
These lanes can create more reliable reload opportunities as harvest volumes increase and grocery supply chains ramp up.
While refrigerated freight follows agricultural cycles, flatbed demand tends to move with construction and industrial activity.
Flatbed Recovery Is Being Driven by Capacity
Flatbed freight markets have shown more stability than other segments recently, but industry analysts say much of that stability is tied to reduced capacity rather than surging demand. According to reporting from FreightWaves, many flatbed carriers exited the market during the freight downturn, tightening the supply of available trucks.
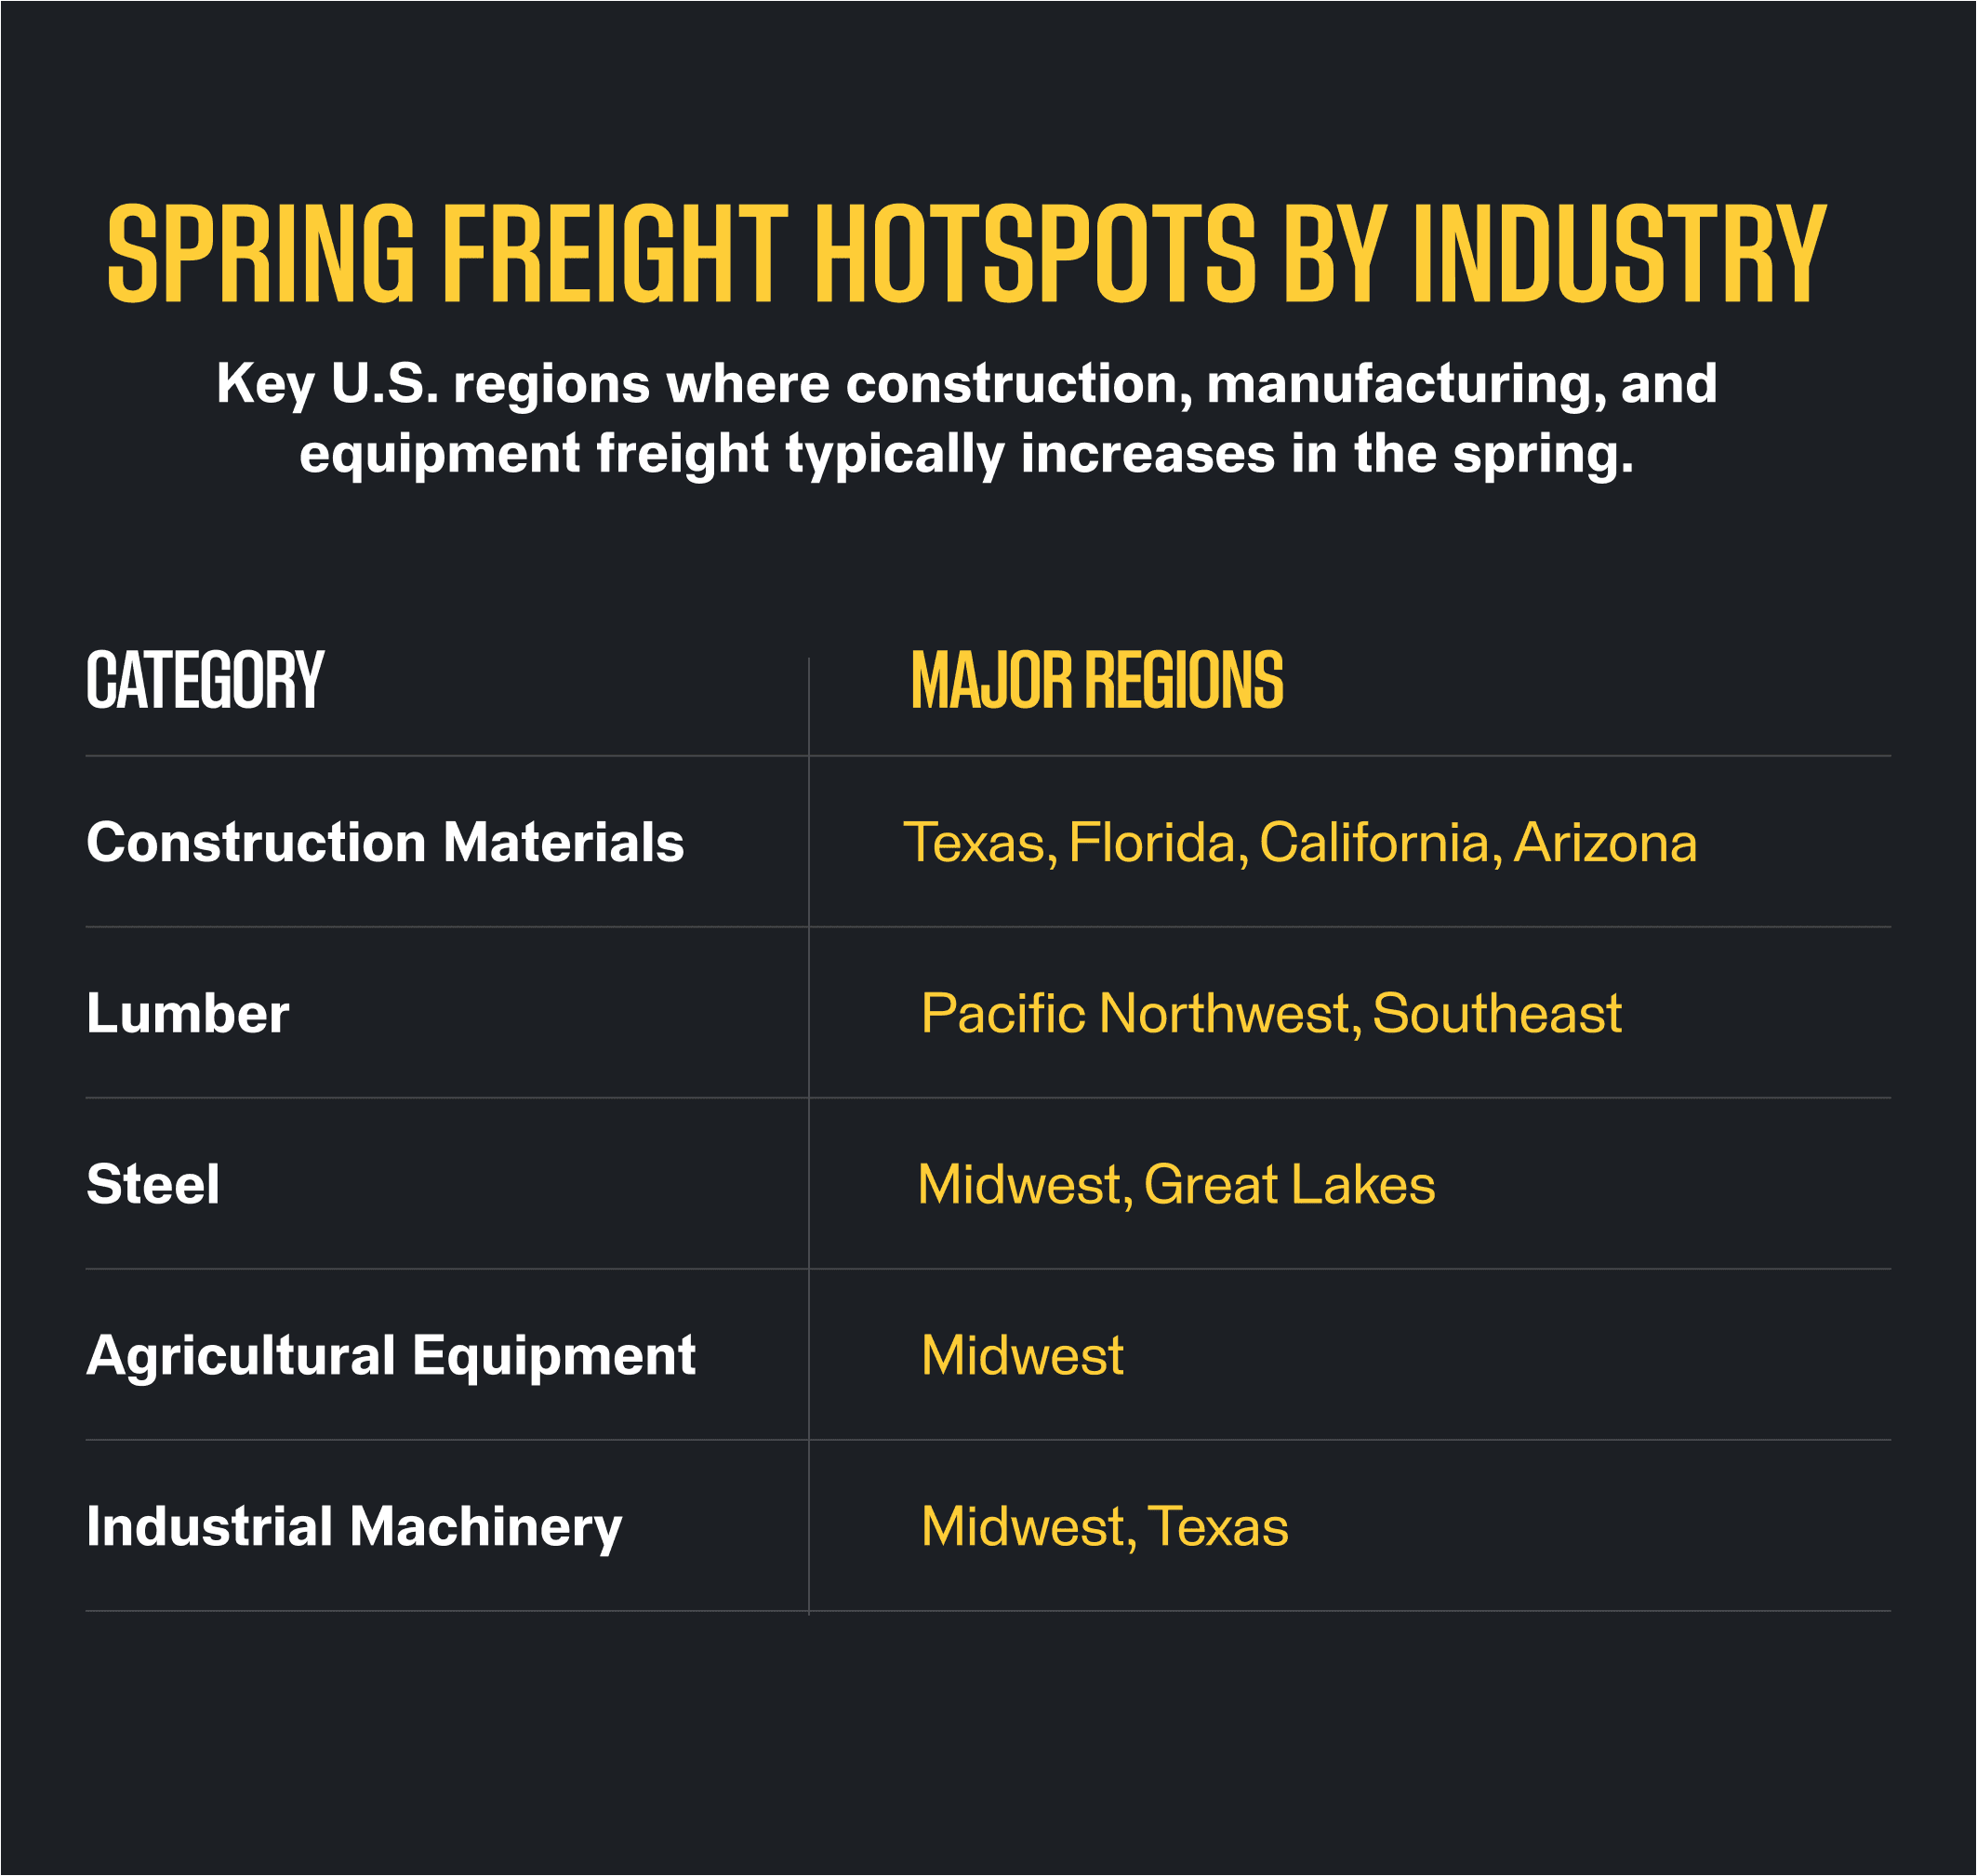
Spring typically brings increased movement of freight such as:
Construction materials
Lumber and steel
Agricultural equipment
Industrial machinery
These shipments often increase as construction projects begin ramping up across many regions. With fewer trucks available compared to previous years, even modest increases in demand can support flatbed rates.
It’s important to note that even when freight demand improves, operating costs—like fuel—are still one of the biggest factors affecting profitability.
Diesel Prices Are Climbing Again
Diesel prices have increased in 2026, which means fuel is still one of the largest operating expenses for trucking businesses. According to the U.S. Energy Information Administration (EIA), diesel prices have risen in recent months due to global oil supply disruptions and geopolitical tensions affecting energy markets.
Higher fuel prices increase the cost per mile for carriers, which can reduce margins on lower-paying loads. Because fuel costs fluctuate frequently, many experienced drivers closely monitor operating habits that affect fuel consumption.
Factors that influence fuel efficiency include:
Deadhead miles
Driving speed
Idle time
Fuel stop planning
Industry experts often emphasize that even small improvements in these areas can help offset rising diesel costs. We put together a list of the top seven fuel efficiency tips from experienced truck drivers to help you navigate the rising cost of fuel.
How Experienced Drivers Are Adapting
Freight markets change constantly. Experienced owner operators often adjust their operating strategies and tactics as conditions change.
Common approaches discussed across driver communities include:
Planning reloads earlier to cut down on empty miles
Monitoring rate trends before committing to lanes
Focusing on stronger regional freight corridors
Minimizing deadhead miles whenever possible
Using tools that simplify dispatch communication and load tracking
Drivers often tell us that the difference between a good week and a great week often comes down to planning. When freight rates are up and down, small adjustments to your schedule and route decisions can add up to significantly more money in your pocket.
Pro Tip: Use the load board not just to find loads, but to track market trends. Knowing where freight is moving helps you stay a step ahead and keep your truck loaded.
While the freight market still faces challenges, seasonal shifts can create new opportunities for drivers who stay informed about changing conditions.
Spring Freight May Signal a Market Reset
The trucking market in 2026 is not booming yet, but many indicators suggest it may be stabilizing after nearly two years of freight recession.
Spot rates are beginning to stabilize. Manufacturing activity may support future dry van demand. Produce season is expected to increase refrigerated freight activity, while flatbed markets have tightened due to reduced capacity. At the same time, rising diesel prices continue to pressure margins across the industry. Monitoring real-time load activity remains one of the most reliable ways to see how freight demand is shifting across different regions and trailer types.
Drivers can track available freight using tools like TruckSmarter’s free load board, or use Dispatch, a load board assistant designed to help carriers find and manage loads more efficiently. You can try Dispatch free for 30-days now.

Written by
TruckSmarter
Share this content

" width="119.06490624254943px"><path d="M 0 80 L 0 0 L 119.055 0 L 119.055 80 Z" fill="transparent" height="80px" id="arm9ASlB9" transform="translate(0.004 0.002)" width="119.055px"/><path d="M 13.744 46.943 C 16.144 48.416 18.378 49.806 20.633 51.156 C 21.93 51.932 23.2 52.841 24.603 53.353 C 27.895 54.557 29.689 57.23 31.474 59.943 C 31.72 60.318 31.773 60.861 31.799 61.333 C 32.024 65.021 33.822 67.716 36.886 69.661 C 37.264 69.9 37.646 70.248 37.844 70.636 C 38.803 72.507 40.148 73.967 41.972 75.026 C 42.676 75.431 43.449 75.895 43.898 76.539 C 45.854 79.371 48.395 80.513 51.714 79.79 C 54.519 79.177 56.854 77.977 57.337 74.673 C 57.742 74.902 58.115 75.118 58.533 75.352 C 58.929 74.92 59.364 74.549 59.672 74.095 C 60.551 72.78 61.632 72.432 63.105 73.098 C 63.888 73.451 64.793 73.534 65.58 73.883 C 65.875 74.015 66.073 74.545 66.147 74.924 C 66.209 75.224 66.015 75.573 65.928 75.952 C 68.029 75.423 69.541 74.104 69.62 72.749 C 69.449 72.688 69.269 72.608 69.084 72.56 C 68.816 72.493 68.539 72.445 68.266 72.396 C 63.237 71.563 58.946 69.26 55.262 65.775 C 55.034 65.559 55.02 65.109 54.906 64.769 C 55.258 64.84 55.675 64.818 55.948 65.007 C 56.599 65.466 57.161 66.044 57.786 66.542 C 59.949 68.254 62.283 69.657 64.868 70.433 C 65.585 69.489 66.191 68.589 66.917 67.8 C 67.154 67.539 67.734 67.389 68.09 67.469 C 69.365 67.756 70.605 68.184 71.867 68.528 C 73.019 68.841 73.142 69.154 72.478 70.195 C 72.197 70.636 71.911 71.077 71.546 71.646 C 74.017 71.082 75.991 68.881 76.373 66.406 C 73.498 66.37 70.781 65.625 68.231 64.385 C 66.121 63.357 64.107 62.136 62.076 60.953 C 61.857 60.825 61.808 60.397 61.681 60.111 C 61.993 60.102 62.331 60.018 62.617 60.111 C 62.951 60.212 63.233 60.477 63.545 60.649 C 65.549 61.761 67.559 62.868 69.585 63.984 C 70.407 62.903 71.018 61.955 71.779 61.152 C 72.161 60.75 72.821 60.389 73.353 60.397 C 74.496 60.406 75.634 60.711 76.786 60.808 C 77.556 60.869 77.863 61.112 77.679 61.928 C 77.437 62.983 77.283 64.059 77.085 65.144 C 79.899 64.981 82.084 61.531 81.007 58.981 C 80.739 58.346 80.879 58.051 81.306 57.667 C 83.319 55.867 85.561 54.61 88.406 54.654 C 88.625 55.157 88.863 55.664 89.069 56.18 C 89.61 57.526 90.19 57.852 91.54 57.358 C 97.409 55.205 103.261 53 109.134 50.851 C 112.418 49.647 115.728 48.518 119.065 47.344 C 118.977 47.08 118.92 46.855 118.832 46.643 C 116.15 40.149 114.058 33.471 112.51 26.611 C 111.952 24.14 111.319 21.688 110.699 19.147 C 110.202 19.301 109.934 19.354 109.688 19.46 C 106.896 20.629 104.127 21.86 101.309 22.967 C 95.154 25.389 88.973 27.749 82.805 30.14 C 81.495 30.647 81.275 31.207 81.807 32.553 C 81.978 32.99 82.119 33.435 82.286 33.912 C 81.438 34.207 80.642 34.375 79.956 34.75 C 77.156 36.281 74.324 36.064 71.418 35.107 C 67.075 33.678 62.661 33.488 58.19 34.467 C 57.931 34.525 57.548 34.467 57.355 34.304 C 54.893 32.227 51.978 31.441 48.848 31.23 C 45.076 30.974 41.484 31.913 37.879 32.813 C 37.475 32.915 36.947 33.065 36.635 32.893 C 32.854 30.837 29.096 28.737 25.359 26.598 C 25.069 26.43 24.831 25.857 24.858 25.495 C 24.924 24.665 24.673 24.048 23.965 23.686 C 20.598 21.957 17.226 20.236 13.823 18.578 C 13.449 18.397 12.579 18.481 12.434 18.728 C 12.016 19.46 12.724 19.738 13.269 20.003 C 15.203 20.947 17.155 21.864 19.072 22.844 C 20.233 23.435 21.345 24.123 22.514 24.785 C 18.839 31.922 14.008 38.279 11.563 46.052 C 8.372 44.389 5.435 42.858 2.498 41.336 C 1.966 41.062 1.439 40.745 0.872 40.599 C 0.63 40.538 0.186 40.78 0.032 41.018 C -0.074 41.177 0.102 41.609 0.269 41.834 C 0.423 42.042 0.722 42.152 0.968 42.28 C 4.463 44.111 7.954 45.955 11.462 47.763 C 12.372 48.231 13.256 48.302 13.744 46.934 Z M 48.307 17.466 C 47.402 18.445 46.223 19.394 44.452 19.045 C 43.85 18.926 43.085 18.794 43.107 19.663 C 43.115 20.034 43.775 20.616 44.223 20.713 C 46.404 21.189 48.079 20.197 49.547 18.679 C 49.82 18.397 50.29 18.009 50.58 18.075 C 54.37 18.953 57.469 17.351 60.428 15.349 C 63.76 13.09 66.591 10.258 69.198 7.201 C 69.484 6.866 69.867 6.561 70.007 6.173 C 70.135 5.825 69.985 5.375 69.959 4.969 C 69.563 5.004 69.106 4.933 68.785 5.11 C 68.42 5.313 68.192 5.745 67.888 6.063 C 66.222 7.788 64.626 9.596 62.859 11.211 C 60.309 13.536 57.588 15.675 54.097 16.399 C 53.183 16.588 52.194 16.429 51.323 16.429 C 51.578 15.075 51.943 13.911 51.987 12.737 C 52.062 10.659 50.8 9.173 49.204 9.186 C 47.643 9.199 46.316 10.748 46.232 12.68 C 46.215 13.037 46.188 13.443 46.338 13.743 C 46.922 14.934 47.573 16.09 48.312 17.466 Z M 76.654 61.893 C 75.56 61.725 74.513 61.549 73.463 61.412 C 73.252 61.386 72.931 61.403 72.821 61.536 C 72.135 62.387 71.493 63.278 70.711 64.324 C 71.933 64.632 72.94 64.954 73.973 65.135 C 75.788 65.457 75.797 65.422 76.268 63.591 C 76.404 63.058 76.514 62.51 76.65 61.897 Z M 66.117 70.848 C 66.785 70.989 67.4 71.108 68.011 71.241 C 69.527 71.57 70.664 71.089 71.423 69.798 C 71.458 69.736 71.462 69.657 71.48 69.577 C 70.908 69.405 70.346 69.22 69.774 69.057 C 68.209 68.616 67.01 69.111 66.178 70.544 C 66.161 70.574 66.161 70.619 66.117 70.839 Z M 14.676 66.79 C 14.425 65.166 14.298 63.935 14.008 62.744 C 13.915 62.361 13.392 62.078 13.071 61.752 C 12.834 62.136 12.372 62.528 12.394 62.894 C 12.473 64.16 12.654 65.426 12.939 66.662 C 13.041 67.094 13.568 67.42 13.902 67.8 C 14.214 67.394 14.526 66.988 14.672 66.794 Z M 7.308 70.808 C 8.772 70.557 9.967 70.424 11.115 70.111 C 11.493 70.01 11.744 69.441 12.056 69.083 C 11.638 68.876 11.207 68.47 10.807 68.497 C 9.66 68.581 8.508 68.77 7.391 69.061 C 7.009 69.163 6.736 69.683 6.411 70.014 C 6.749 70.31 7.084 70.61 7.312 70.808 Z M 59.566 76.067 C 61.039 76.164 62.287 76.243 63.54 76.322 C 64.578 76.389 65.079 75.956 64.912 74.88 C 61.267 73.57 61.197 73.583 59.566 76.062 Z M 15.744 74.104 C 15.608 72.82 15.599 71.849 15.366 70.936 C 15.261 70.513 14.715 70.204 14.368 69.842 C 14.113 70.27 13.638 70.702 13.643 71.13 C 13.652 72.07 13.819 73.032 14.087 73.936 C 14.197 74.302 14.694 74.708 15.072 74.787 C 15.283 74.831 15.626 74.231 15.744 74.104 Z M 91.039 1.991 C 91.039 1.523 91.096 1.329 91.03 1.206 C 90.793 0.778 90.564 0.081 90.23 0.019 C 89.434 -0.126 89.338 0.584 89.302 1.223 C 89.25 2.141 89.109 3.063 89.144 3.976 C 89.157 4.32 89.549 4.651 89.764 4.986 C 90.103 4.722 90.648 4.514 90.74 4.179 C 90.964 3.381 90.977 2.52 91.039 1.991 Z M 90.287 8.498 C 90.081 8.224 89.808 7.488 89.404 7.408 C 88.564 7.241 88.617 8.105 88.516 8.661 C 88.366 9.486 88.199 10.32 88.181 11.153 C 88.173 11.498 88.542 11.846 88.74 12.195 C 89.091 11.947 89.654 11.767 89.76 11.44 C 90.023 10.611 90.085 9.72 90.283 8.493 Z M 85.662 7.664 C 85.662 7.664 85.662 7.638 85.662 7.624 C 86.023 7.624 86.432 7.735 86.726 7.598 C 87.1 7.426 87.377 7.046 87.698 6.76 C 87.377 6.482 87.087 6.023 86.731 5.97 C 85.952 5.855 85.135 5.895 84.348 5.988 C 84.084 6.019 83.653 6.416 83.666 6.623 C 83.688 6.932 83.97 7.364 84.251 7.488 C 84.669 7.668 85.183 7.62 85.654 7.668 Z M 17.683 69.203 C 18.637 69.017 19.292 68.969 19.872 68.739 C 20.158 68.625 20.541 68.086 20.47 67.892 C 20.351 67.57 19.916 67.191 19.591 67.164 C 18.971 67.12 18.298 67.213 17.723 67.438 C 17.322 67.592 17.046 68.064 16.716 68.395 C 17.089 68.704 17.463 69.017 17.683 69.198 Z M 95.708 7.933 L 95.387 7.28 C 94.912 6.994 94.472 6.597 93.962 6.447 C 93.4 6.283 92.771 6.323 92.178 6.358 C 92.129 6.358 91.997 7.232 92.103 7.28 C 92.938 7.677 93.804 8.026 94.692 8.264 C 94.982 8.343 95.369 8.057 95.712 7.933 Z" fill="rgb(255, 255, 255)" height="80.00144772270971px" id="YehhatbY8" transform="translate(0 0)" width="119.06490624251232px"/><path d="M 13.744 28.453 C 13.256 29.821 12.372 29.75 11.462 29.283 C 7.954 27.474 4.463 25.635 0.968 23.799 C 0.722 23.672 0.423 23.561 0.269 23.354 C 0.102 23.129 -0.074 22.697 0.032 22.538 C 0.186 22.304 0.63 22.057 0.872 22.119 C 1.439 22.269 1.966 22.582 2.498 22.855 C 5.435 24.377 8.367 25.908 11.563 27.571 C 14.008 19.798 18.839 13.437 22.514 6.304 C 21.345 5.642 20.233 4.954 19.072 4.363 C 17.155 3.384 15.203 2.466 13.269 1.522 C 12.724 1.257 12.016 0.98 12.434 0.247 C 12.575 0 13.449 -0.084 13.823 0.097 C 17.226 1.756 20.598 3.476 23.965 5.206 C 24.673 5.567 24.924 6.185 24.858 7.014 C 24.831 7.376 25.064 7.949 25.359 8.117 C 29.096 10.257 32.854 12.356 36.635 14.412 C 36.947 14.58 37.475 14.434 37.879 14.333 C 41.484 13.433 45.076 12.493 48.848 12.749 C 51.983 12.961 54.893 13.746 57.355 15.824 C 57.548 15.987 57.931 16.044 58.19 15.987 C 62.661 15.008 67.075 15.193 71.418 16.627 C 74.324 17.584 77.151 17.8 79.956 16.269 C 80.642 15.894 81.442 15.727 82.286 15.431 C 82.119 14.955 81.978 14.505 81.807 14.072 C 81.275 12.727 81.495 12.167 82.805 11.659 C 88.973 9.268 95.154 6.908 101.309 4.487 C 104.127 3.379 106.896 2.149 109.688 0.98 C 109.934 0.878 110.202 0.821 110.699 0.666 C 111.319 3.207 111.956 5.66 112.51 8.13 C 114.053 14.986 116.15 21.664 118.832 28.162 C 118.92 28.374 118.977 28.599 119.065 28.864 C 115.733 30.037 112.422 31.171 109.134 32.371 C 103.261 34.519 97.409 36.725 91.54 38.877 C 90.19 39.372 89.61 39.045 89.069 37.7 C 88.863 37.184 88.625 36.681 88.406 36.173 C 85.561 36.134 83.324 37.386 81.306 39.186 C 80.875 39.57 80.739 39.861 81.007 40.501 C 82.079 43.046 79.899 46.5 77.085 46.664 C 77.283 45.574 77.437 44.502 77.679 43.448 C 77.863 42.632 77.556 42.393 76.786 42.327 C 75.639 42.23 74.5 41.93 73.353 41.917 C 72.821 41.912 72.161 42.27 71.779 42.671 C 71.014 43.474 70.403 44.423 69.585 45.503 C 67.563 44.387 65.554 43.28 63.545 42.168 C 63.233 41.996 62.951 41.732 62.617 41.63 C 62.331 41.542 61.997 41.63 61.681 41.63 C 61.808 41.917 61.857 42.345 62.076 42.473 C 64.107 43.655 66.121 44.877 68.231 45.905 C 70.781 47.149 73.502 47.89 76.373 47.925 C 75.991 50.4 74.017 52.597 71.546 53.166 C 71.911 52.597 72.197 52.156 72.478 51.715 C 73.142 50.673 73.019 50.36 71.867 50.047 C 70.605 49.703 69.361 49.275 68.09 48.988 C 67.73 48.909 67.154 49.054 66.917 49.319 C 66.196 50.109 65.589 51.009 64.868 51.953 C 62.283 51.176 59.949 49.778 57.786 48.062 C 57.161 47.568 56.594 46.986 55.948 46.527 C 55.68 46.337 55.258 46.364 54.906 46.289 C 55.02 46.628 55.029 47.074 55.262 47.294 C 58.946 50.779 63.237 53.082 68.266 53.916 C 68.539 53.96 68.816 54.008 69.084 54.079 C 69.273 54.128 69.453 54.207 69.62 54.269 C 69.537 55.623 68.025 56.942 65.928 57.471 C 66.02 57.096 66.209 56.743 66.147 56.444 C 66.068 56.064 65.875 55.53 65.58 55.402 C 64.793 55.05 63.888 54.97 63.105 54.617 C 61.632 53.951 60.555 54.3 59.672 55.614 C 59.364 56.069 58.933 56.439 58.533 56.871 C 58.115 56.633 57.742 56.421 57.337 56.192 C 56.849 59.496 54.515 60.696 51.714 61.309 C 48.395 62.033 45.854 60.89 43.898 58.058 C 43.454 57.414 42.676 56.951 41.972 56.545 C 40.148 55.491 38.803 54.031 37.844 52.156 C 37.646 51.767 37.26 51.423 36.886 51.181 C 33.826 49.235 32.024 46.54 31.799 42.852 C 31.773 42.38 31.72 41.838 31.474 41.463 C 29.689 38.75 27.891 36.076 24.603 34.872 C 23.2 34.36 21.934 33.452 20.633 32.675 C 18.378 31.325 16.144 29.931 13.744 28.462 Z M 87.584 34.541 C 85.917 28.705 84.251 22.864 82.55 16.905 C 81.503 17.377 80.488 17.932 79.406 18.294 C 78.255 18.682 77.015 19.194 75.863 19.101 C 73.973 18.947 72.095 18.426 70.253 17.919 C 67.136 17.054 64.006 16.662 60.784 17.116 C 58.181 17.482 55.574 17.791 52.967 18.135 C 52.708 18.171 52.457 18.285 52.207 18.36 C 52.158 19.119 52.075 19.798 52.079 20.473 C 52.088 21.488 51.605 21.92 50.62 21.929 C 49.143 21.942 47.665 22.053 46.188 22 C 45.168 21.964 44.597 21.342 44.667 20.253 C 44.72 19.468 44.786 18.682 44.865 17.628 C 43.968 18.179 43.186 18.519 42.597 19.066 C 42.21 19.428 41.911 20.085 41.898 20.614 C 41.862 22.053 43.291 23.989 44.68 24.307 C 47.164 24.871 49.661 25.44 52.185 25.736 C 56.542 26.248 60.969 26.385 64.855 28.775 C 65.211 28.996 65.396 29.499 65.664 29.869 C 65.18 29.989 64.626 30.319 64.231 30.187 C 63.184 29.825 62.217 29.23 61.193 28.793 C 60.652 28.564 60.054 28.484 59.478 28.339 C 59.425 28.449 59.368 28.559 59.316 28.665 C 59.949 29.314 60.485 30.121 61.232 30.58 C 63.545 31.983 65.844 33.478 68.319 34.523 C 71.946 36.054 75.722 37.232 79.565 38.608 C 83.126 35.516 83.785 35.176 87.57 34.541 Z M 39.414 51.582 C 40.398 53.792 43.247 56.099 44.729 55.773 C 44.061 55.005 43.401 54.273 42.764 53.519 C 42.337 53.016 42.082 52.429 42.742 51.962 C 43.788 51.216 44.883 50.537 45.977 49.866 C 46.668 49.443 47.292 49.685 47.802 50.228 C 48.536 51.009 49.239 51.816 49.995 52.663 C 50.927 51.154 50.765 50.104 49.648 49.165 C 48.061 47.828 45.138 47.762 43.353 48.988 C 42.078 49.862 40.777 50.687 39.414 51.578 Z M 33.721 44.405 C 34.147 46.769 36.055 49.187 37.866 49.619 C 37.484 48.9 37.075 48.256 36.802 47.563 C 36.657 47.197 36.609 46.677 36.758 46.333 C 37.101 45.534 40.064 44.237 40.86 44.52 C 41.234 44.652 41.55 45.018 41.823 45.34 C 42.188 45.768 42.491 46.253 42.816 46.712 C 42.948 46.646 43.085 46.575 43.216 46.509 C 42.988 45.834 42.887 45.08 42.513 44.502 C 41.55 43.002 39.585 42.411 37.726 42.998 C 36.402 43.417 35.101 43.915 33.716 44.405 Z M 55.473 57.154 C 55.544 56.951 55.601 56.841 55.618 56.721 C 55.847 55.398 55.231 54.335 53.855 53.66 C 52.515 53.003 51.903 53.175 50.813 54.233 C 50.075 54.952 49.248 55.61 48.364 56.135 C 47.468 56.669 46.461 57.008 45.423 57.467 C 46.456 58.821 47.67 59.651 49.477 60.048 C 49.222 59.426 48.932 59.055 48.958 58.711 C 49.002 58.16 49.094 57.436 49.455 57.123 C 51.301 55.517 53.64 55.561 55.473 57.154 Z M 49.015 53.792 C 46.575 51.004 46.786 50.784 44.214 52.57 C 45.63 55.376 46.698 55.663 49.015 53.792 Z M 46.18 20.394 L 50.439 20.394 L 50.439 18.378 C 49.705 18.316 49.072 18.294 48.448 18.197 C 47.833 18.1 47.226 17.924 46.536 17.765 C 46.413 18.669 46.303 19.485 46.18 20.389 Z M 38.297 47.012 C 38.754 47.89 39.176 48.71 39.638 49.597 C 40.425 49.129 41.124 48.715 41.902 48.252 C 41.344 47.449 40.851 46.747 40.341 46.011 C 39.625 46.359 38.987 46.672 38.297 47.012 Z M 54.462 58.579 C 53.935 58.01 53.592 57.639 53.222 57.242 C 52.308 57.608 51.437 57.961 50.571 58.31 C 51.09 59.902 51.095 59.928 52.51 59.452 C 53.13 59.245 53.71 58.923 54.462 58.579 Z" fill="rgb(28, 28, 28)" height="61.52091093053766px" id="AUI_ToKxq" transform="translate(0 18.49)" width="119.06490624251232px"/><path d="M 5.206 12.497 C 4.471 11.125 3.816 9.965 3.232 8.774 C 3.082 8.474 3.113 8.064 3.126 7.711 C 3.21 5.779 4.537 4.23 6.098 4.217 C 7.694 4.204 8.956 5.686 8.881 7.768 C 8.841 8.946 8.472 10.111 8.217 11.461 C 9.088 11.461 10.077 11.624 10.991 11.43 C 14.482 10.702 17.199 8.567 19.753 6.242 C 21.525 4.628 23.116 2.819 24.782 1.094 C 25.09 0.776 25.319 0.344 25.679 0.141 C 26 -0.035 26.457 0.035 26.853 0 C 26.879 0.406 27.024 0.856 26.901 1.204 C 26.761 1.593 26.378 1.897 26.092 2.232 C 23.485 5.289 20.658 8.121 17.322 10.38 C 14.363 12.387 11.264 13.984 7.474 13.106 C 7.188 13.04 6.718 13.424 6.441 13.71 C 4.973 15.232 3.293 16.225 1.117 15.744 C 0.669 15.647 0.009 15.069 0 14.694 C -0.022 13.825 0.743 13.957 1.346 14.077 C 3.117 14.425 4.3 13.472 5.201 12.497 Z M 6.678 10.764 C 6.841 9.44 7.078 8.293 7.07 7.151 C 7.07 6.758 6.445 6.374 6.107 5.986 C 5.738 6.352 5.206 6.652 5.025 7.098 C 4.515 8.329 5.069 9.595 6.678 10.764 Z" fill="rgb(28, 28, 28)" height="15.86627501441505px" id="yPoKMbiu4" transform="translate(43.102 4.969)" width="26.95005054146612px"/><path d="M 5.939 0.496 C 5.803 1.109 5.698 1.656 5.557 2.19 C 5.087 4.02 5.073 4.056 3.262 3.734 C 2.229 3.553 1.218 3.231 0 2.922 C 0.783 1.876 1.42 0.985 2.11 0.134 C 2.216 0.002 2.541 -0.016 2.752 0.01 C 3.803 0.152 4.849 0.324 5.944 0.491 Z" fill="rgb(28, 28, 28)" height="3.8886439509467223px" id="KE_IYPS9y" transform="translate(70.719 61.396)" width="5.94380000000001px"/><path d="M 0 1.938 C 0.044 1.717 0.044 1.673 0.062 1.642 C 0.894 0.21 2.093 -0.285 3.658 0.156 C 4.229 0.319 4.792 0.5 5.363 0.676 C 5.346 0.756 5.341 0.835 5.306 0.897 C 4.547 2.188 3.41 2.669 1.895 2.339 C 1.284 2.207 0.673 2.084 0 1.947 Z" fill="rgb(28, 28, 28)" height="2.439844994446446px" id="Lp02kc33H" transform="translate(66.117 68.91)" width="5.363399999999999px"/><path d="M 2.278 5.042 C 2.129 5.236 1.821 5.642 1.509 6.048 C 1.175 5.673 0.647 5.342 0.546 4.91 C 0.256 3.679 0.08 2.409 0.001 1.142 C -0.021 0.776 0.44 0.384 0.678 0 C 1.003 0.326 1.522 0.609 1.614 0.992 C 1.904 2.184 2.027 3.414 2.282 5.038 Z" fill="rgb(28, 28, 28)" height="6.048000000000002px" id="k7R2ADIbW" transform="translate(12.398 61.748)" width="2.2823591652395763px"/><path d="M 0.901 2.313 C 0.677 2.115 0.339 1.815 0 1.519 C 0.325 1.188 0.598 0.668 0.98 0.566 C 2.093 0.275 3.249 0.081 4.396 0.002 C 4.796 -0.029 5.227 0.381 5.645 0.588 C 5.337 0.946 5.082 1.51 4.704 1.616 C 3.557 1.929 2.361 2.062 0.897 2.313 Z" fill="rgb(28, 28, 28)" height="2.313241858581634px" id="g_CgwalTO" transform="translate(6.41 68.49)" width="5.64475px"/><path d="M 0 2.048 C 1.627 -0.431 1.697 -0.444 5.346 0.866 C 5.513 1.942 5.012 2.374 3.974 2.308 C 2.721 2.229 1.473 2.145 0 2.052 Z" fill="rgb(28, 28, 28)" height="2.3149121127885337px" id="aji9yeYkW" transform="translate(59.566 74.014)" width="5.377398764721633px"/><path d="M 2.101 4.261 C 1.983 4.389 1.644 4.989 1.429 4.945 C 1.046 4.87 0.55 4.464 0.444 4.094 C 0.18 3.189 0.009 2.228 0 1.288 C 0 0.86 0.47 0.428 0.725 0 C 1.073 0.362 1.614 0.671 1.723 1.094 C 1.956 2.007 1.965 2.973 2.101 4.261 Z" fill="rgb(28, 28, 28)" height="4.947511468933342px" id="dFndV1vT1" transform="translate(13.645 69.838)" width="2.1014000000000017px"/><path d="M 1.899 1.991 C 1.838 2.525 1.824 3.381 1.6 4.179 C 1.508 4.514 0.963 4.722 0.624 4.986 C 0.404 4.651 0.018 4.32 0.004 3.976 C -0.026 3.063 0.114 2.141 0.163 1.223 C 0.198 0.584 0.294 -0.126 1.09 0.019 C 1.42 0.081 1.649 0.778 1.89 1.206 C 1.961 1.329 1.899 1.519 1.899 1.991 Z" fill="rgb(28, 28, 28)" height="4.986373229619275px" id="R9TGjE_vm" transform="translate(89.141 0)" width="1.9240640022925533px"/><path d="M 2.101 1.106 C 1.899 2.328 1.842 3.224 1.578 4.053 C 1.473 4.38 0.91 4.561 0.558 4.808 C 0.361 4.459 -0.004 4.111 0 3.767 C 0.018 2.933 0.185 2.099 0.334 1.274 C 0.435 0.714 0.378 -0.146 1.222 0.021 C 1.627 0.101 1.899 0.837 2.106 1.111 Z" fill="rgb(28, 28, 28)" height="4.807577536542174px" id="Q2stYnNDQ" transform="translate(88.187 7.393)" width="2.105839431750411px"/><path d="M 1.987 1.769 C 1.513 1.72 0.998 1.769 0.585 1.588 C 0.304 1.464 0.018 1.036 0 0.723 C -0.013 0.516 0.418 0.119 0.682 0.088 C 1.469 -0.005 2.282 -0.044 3.064 0.07 C 3.416 0.123 3.711 0.582 4.032 0.86 C 3.711 1.147 3.434 1.526 3.06 1.698 C 2.765 1.835 2.357 1.725 1.996 1.725 C 1.996 1.738 1.996 1.751 1.996 1.764 Z" fill="rgb(28, 28, 28)" height="1.7687590190909495px" id="MosVPZvMT" transform="translate(83.676 5.896)" width="4.031596362651712px"/><path d="M 0.967 2.044 C 0.747 1.863 0.374 1.555 0 1.241 C 0.33 0.911 0.607 0.439 1.007 0.284 C 1.583 0.059 2.255 -0.033 2.875 0.011 C 3.2 0.033 3.64 0.417 3.755 0.739 C 3.825 0.933 3.442 1.471 3.157 1.586 C 2.576 1.815 1.921 1.859 0.967 2.049 Z" fill="rgb(28, 28, 28)" height="2.048781677318786px" id="pTC94CglR" transform="translate(16.719 67.158)" width="3.7629630781345362px"/><path d="M 3.649 1.605 C 3.306 1.724 2.919 2.01 2.629 1.935 C 1.741 1.697 0.875 1.344 0.04 0.952 C -0.066 0.903 0.066 0.034 0.115 0.03 C 0.708 -0.001 1.337 -0.045 1.9 0.118 C 2.414 0.268 2.854 0.665 3.324 0.952 L 3.645 1.605 Z" fill="rgb(28, 28, 28)" height="1.9476963300683403px" id="KfpuFUC5I" transform="translate(92.062 6.328)" width="3.6492158017108522px"/><path d="M 45.673 17.637 C 41.888 18.268 41.229 18.607 37.668 21.704 C 33.825 20.332 30.049 19.154 26.422 17.619 C 23.947 16.574 21.643 15.078 19.335 13.675 C 18.588 13.221 18.052 12.409 17.419 11.761 C 17.471 11.65 17.529 11.54 17.581 11.434 C 18.153 11.58 18.755 11.664 19.296 11.889 C 20.325 12.321 21.287 12.921 22.334 13.283 C 22.729 13.419 23.283 13.084 23.767 12.965 C 23.503 12.594 23.318 12.092 22.958 11.871 C 19.067 9.476 14.645 9.343 10.288 8.832 C 7.764 8.536 5.267 7.967 2.783 7.402 C 1.394 7.085 -0.035 5.148 0.001 3.71 C 0.014 3.176 0.308 2.519 0.7 2.162 C 1.289 1.615 2.071 1.271 2.968 0.724 C 2.889 1.778 2.823 2.563 2.77 3.348 C 2.696 4.433 3.267 5.06 4.291 5.095 C 5.764 5.148 7.246 5.033 8.723 5.025 C 9.708 5.016 10.191 4.583 10.182 3.569 C 10.178 2.894 10.262 2.215 10.31 1.456 C 10.56 1.381 10.807 1.266 11.07 1.231 C 13.673 0.887 16.284 0.578 18.887 0.212 C 22.109 -0.243 25.24 0.15 28.357 1.015 C 30.199 1.526 32.076 2.047 33.966 2.197 C 35.122 2.29 36.358 1.778 37.51 1.39 C 38.591 1.028 39.607 0.472 40.653 0 C 42.354 5.96 44.02 11.805 45.687 17.637 Z" fill="rgb(255, 255, 255)" height="21.703900000000004px" id="MkiwzIflB" transform="translate(41.91 35.389)" width="45.686537391038px"/><path d="M 0 3.461 C 1.358 2.57 2.664 1.741 3.939 0.872 C 5.724 -0.35 8.647 -0.284 10.234 1.048 C 11.351 1.988 11.514 3.033 10.582 4.546 C 9.821 3.699 9.118 2.892 8.388 2.111 C 7.878 1.569 7.254 1.326 6.564 1.75 C 5.469 2.42 4.374 3.099 3.328 3.845 C 2.668 4.313 2.923 4.899 3.35 5.402 C 3.987 6.152 4.647 6.889 5.315 7.656 C 3.838 7.987 0.985 5.68 0 3.466 Z" fill="rgb(255, 255, 255)" height="7.688222532206723px" id="cNTEkvgx5" transform="translate(39.414 66.605)" width="11.18823581395253px"/><path d="M 0 1.631 C 1.385 1.141 2.686 0.643 4.009 0.224 C 5.869 -0.363 7.834 0.228 8.797 1.728 C 9.17 2.31 9.272 3.06 9.5 3.735 C 9.368 3.801 9.232 3.872 9.1 3.938 C 8.77 3.479 8.471 2.994 8.107 2.566 C 7.834 2.248 7.518 1.882 7.144 1.745 C 6.348 1.459 3.385 2.76 3.042 3.558 C 2.893 3.903 2.941 4.423 3.086 4.789 C 3.359 5.482 3.767 6.126 4.15 6.845 C 2.343 6.417 0.431 3.995 0.004 1.631 Z" fill="rgb(255, 255, 255)" height="6.844979135296477px" id="u4zFydL7P" transform="translate(33.723 61.264)" width="9.500299999999996px"/><path d="M 10.05 3.881 C 8.217 2.289 5.878 2.244 4.031 3.85 C 3.671 4.163 3.578 4.891 3.535 5.438 C 3.508 5.782 3.798 6.157 4.053 6.775 C 2.246 6.382 1.033 5.549 0 4.194 C 1.038 3.735 2.049 3.396 2.941 2.862 C 3.82 2.337 4.651 1.68 5.39 0.961 C 6.48 -0.098 7.091 -0.27 8.432 0.387 C 9.812 1.062 10.428 2.125 10.195 3.449 C 10.173 3.563 10.12 3.674 10.05 3.881 Z" fill="rgb(255, 255, 255)" height="6.774829090792053px" id="o4NKSEXZw" transform="translate(45.422 71.758)" width="10.243105352586447px"/><path d="M 4.801 2.369 C 2.484 4.24 1.416 3.953 0 1.147 C 2.572 -0.639 2.361 -0.419 4.801 2.369 Z" fill="rgb(255, 255, 255)" height="3.5577118890110313px" id="SuCvzlmKx" transform="translate(44.215 69.908)" width="4.800799999999995px"/><path d="M 0 2.625 C 0.123 1.72 0.233 0.904 0.356 0 C 1.042 0.159 1.649 0.335 2.269 0.432 C 2.893 0.529 3.53 0.551 4.26 0.613 L 4.26 2.629 L 0 2.629 Z" fill="rgb(255, 255, 255)" height="2.629100000000001px" id="VNK5ZGit6" transform="translate(46.184 36.254)" width="4.260000000000005px"/><path d="M 0 1.001 C 0.695 0.662 1.328 0.353 2.044 0 C 2.554 0.732 3.047 1.438 3.605 2.241 C 2.827 2.704 2.128 3.119 1.341 3.587 C 0.879 2.7 0.457 1.884 0 1.001 Z" fill="rgb(255, 255, 255)" height="3.586500000000001px" id="CJhYUhMbL" transform="translate(38.301 64.496)" width="3.6049000000000007px"/><path d="M 3.891 1.337 C 3.139 1.676 2.559 1.998 1.939 2.21 C 0.528 2.687 0.519 2.665 0 1.068 C 0.866 0.719 1.736 0.371 2.651 0 C 3.016 0.393 3.363 0.768 3.891 1.337 Z" fill="rgb(255, 255, 255)" height="2.4810193044393998px" id="N1DLKnNiM" transform="translate(50.566 75.727)" width="3.8907000000000025px"/><path d="M 1.836 4.778 C 0.227 3.609 -0.327 2.338 0.183 1.112 C 0.368 0.666 0.896 0.366 1.265 0 C 1.603 0.388 2.223 0.772 2.228 1.165 C 2.236 2.307 1.999 3.454 1.836 4.778 Z" fill="rgb(255, 255, 255)" height="4.777500000000002px" id="XYABd_HEJ" transform="translate(47.945 10.955)" width="2.227916140291171px"/></g></svg>)
